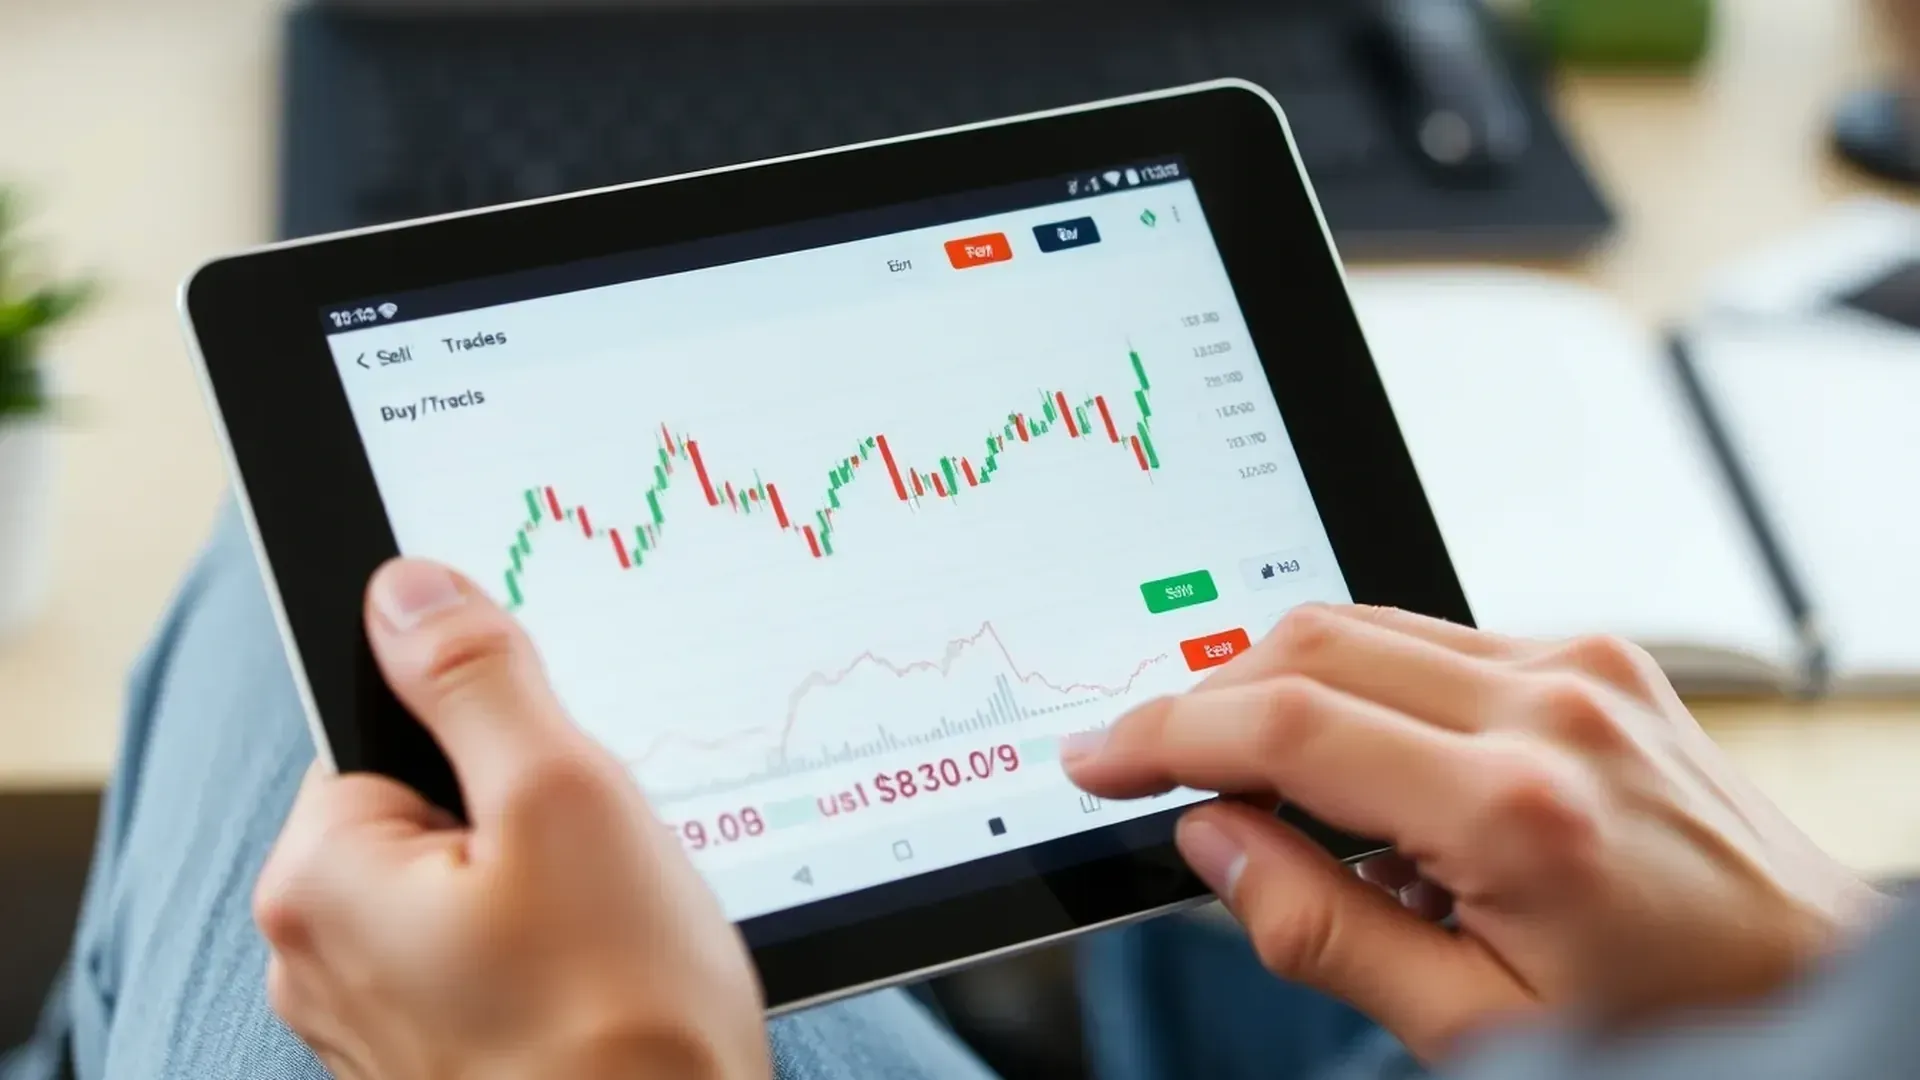
When it comes to forex trading, there are countless strategies and techniques that traders use to make informed decisions. One such approach is technical analysis. As a seasoned forex trader, I have witnessed firsthand the power and effectiveness of technical analysis in predicting market movements and identifying potential trading opportunities. In this article, I’ll delve into the world of technical analysis and explain how it can be a valuable tool in your forex trading arsenal.
Technical analysis involves the study of historical price data, chart patterns, and various indicators to forecast future price movements. By analysing past market behaviour, I’ll show you how you can gain insights into potential trends, reversals, and support and resistance levels. Whether you’re a beginner or an experienced trader, understanding technical analysis can help you make more informed trading decisions and improve your overall profitability.
What is Technical Analysis?
When it comes to forex trading, technical analysis plays a crucial role in helping traders make informed decisions. But what exactly is technical analysis?
Technical analysis involves studying historical price data, chart patterns, and indicators to predict future price movements. It is based on the belief that historical price data can provide valuable insights into the market’s behaviour. By analysing past price patterns, traders can identify potential trends, reversals, and support and resistance levels.
Technical analysis focuses on the principle that market prices follow trends and patterns and that these trends and patterns tend to repeat over time. Traders use various tools and techniques, such as trendlines, moving averages, and oscillators, to identify and interpret these patterns.
By understanding technical analysis, traders can gain a deeper understanding of market dynamics, enabling them to make more accurate predictions about future price movements. It helps them identify potential entry and exit points, manage risk, and improve overall profitability.
Technical analysis is not a crystal ball that guarantees success, but it provides traders with a systematic approach to interpreting and analysing market data. It helps to remove emotions from trading decisions and rely on objective data instead.
In the next section, I will delve deeper into the key principles of technical analysis and discuss some of the popular technical indicators used by traders.
The Importance of Technical Analysis in Forex Trading
When it comes to forex trading, there are many factors that can impact the value of currencies. From economic data to geopolitical events, the market can be influenced by a wide range of variables. As a forex trader, it’s crucial to stay informed and make well-informed decisions. This is where technical analysis comes in.
Technical analysis is a method of analyzing financial markets that relies on historical price data, chart patterns, and various indicators to predict future price movements. By studying price patterns and trends, technical analysts aim to identify potential trading opportunities.
One of the key reasons why technical analysis is important in forex trading is its ability to provide insights into potential trends. By examining historical price data, analysts can identify patterns that tend to repeat over time. This can be invaluable for traders looking to capitalize on market trends and make profitable trades.
Another benefit of technical analysis is its ability to identify potential reversals in the market. Through the use of indicators such as moving averages or the Relative Strength Index (RSI), traders can spot when a currency pair might be reaching overbought or oversold levels. This information can be crucial for traders looking to enter or exit positions at the right time.
Technical analysis also helps traders identify support and resistance levels in the market. Support levels are price levels where the currency pair has historically found buying pressure, causing the price to bounce back up. On the other hand, resistance levels are price levels where the currency pair has historically encountered selling pressure, causing the price to drop. By identifying these levels, traders can set their entry and exit points more effectively.
One of the great advantages of technical analysis is that it removes emotions from trading decisions. Instead of relying on gut feelings or reacting to market noise, technical analysis allows traders to make decisions based on objective data. This can help traders stay disciplined and make rational choices, ultimately improving their overall profitability.
Technical analysis is an essential tool for forex traders. It provides valuable insights into potential trends, reversals, and support and resistance levels. By using historical price data and various indicators, traders can make well-informed decisions and increase their chances of success in the forex market. So, if you’re a forex trader looking to enhance your trading strategies, it’s definitely worth diving deeper into the world of technical analysis.
Key Concepts in Technical Analysis
When it comes to forex trading, understanding the key concepts of technical analysis is crucial. Technical analysis involves studying historical price data, chart patterns, and indicators to predict future price movements. In this section, I will explain some of the fundamental concepts that traders use to analyze the markets and make informed trading decisions.
Trend Analysis
One of the core principles of technical analysis is the idea that market prices follow trends. A trend is the general direction in which a market is moving, either upwards (bullish) or downwards (bearish). By identifying and analysing trends, traders can gain valuable insights into the potential direction of future price movements.
Support and Resistance Levels
Support and resistance levels are areas on a chart where the price tends to stall or reverse. These levels are important because they provide traders with potential entry and exit points. A support level is a price level at which demand for an asset is strong enough to prevent it from falling further. Conversely, a resistance level is a price level at which selling pressure is strong enough to prevent the price from rising further.
Chart Patterns
Chart patterns are geometric shapes that form on a price chart. These patterns provide traders with valuable information about potential trend reversals or continuations. There are various types of chart patterns, such as head and shoulders, triangles, and double tops/bottoms. Each pattern has its own set of rules and implications, which traders use to make decisions about their trades.
Indicators
Indicators are mathematical calculations applied to a price chart that provide additional information about the market. There are many different types of indicators, including moving averages, oscillators, and volatility indicators. These tools help traders identify trends, momentum, and overbought or oversold conditions.
Candlestick Analysis
Candlestick analysis is a popular method used in technical analysis. Candlestick charts display price movements in a visually meaningful way. Each candlestick represents a specific time period and provides information about the opening, closing, high, and low prices. Traders use candlestick patterns and formations to identify potential trend reversals or continuations.
Types of Technical Analysis Tools and Indicators
When it comes to technical analysis in forex trading, there are a wide range of tools and indicators that traders use to identify and interpret patterns, trends, and potential trading opportunities. These tools and indicators provide valuable insights into the dynamics of the market and help traders make informed decisions. Here are some of the most commonly used technical analysis tools and indicators:
- Moving averages: Moving averages smooth out price data over a specific period of time and help traders identify the direction of the trend. They can be used to generate buy or sell signals when a shorter-term moving average crosses above or below a longer-term moving average.
- Relative Strength Index (RSI): The RSI is a momentum oscillator that measures the speed and change of price movements. It helps traders determine whether a currency pair is overbought or oversold and can be used to identify potential trend reversals.
- Bollinger Bands: Bollinger Bands consist of a moving average and two standard deviation bands. They are used to measure volatility and identify potential price reversals. When the price moves towards the upper band, it suggests that the market is overbought, while a move towards the lower band indicates that the market is oversold.
- Fibonacci retracement: The Fibonacci retracement tool is based on the Fibonacci sequence and is used to identify potential support and resistance levels. Traders use this tool to determine where price corrections are likely to end and where the trend is likely to resume.
- Candlestick patterns: Candlestick patterns provide information about the psychological dynamics between buyers and sellers. They can help traders identify potential trend reversals, market indecision, or continuation patterns.
- MACD (Moving Average Convergence Divergence): The MACD is a trend-following momentum indicator that shows the relationship between two moving averages. It helps traders identify the strength and direction of the trend and generate buy or sell signals.
- Ichimoku Cloud: The Ichimoku Cloud is a comprehensive indicator that provides information about the trend, support and resistance levels, and potential trading signals. It consists of several components, including the Cloud, the Tenkan-sen, the Kijun-sen, and the Chikou Span.
The Role of Chart Patterns in Technical Analysis
When it comes to technical analysis in forex trading, one cannot ignore the importance of chart patterns. Chart patterns are visual representations of price movements that can help traders identify potential trading opportunities. These patterns are formed by the interaction between supply and demand, and they often repeat themselves in the market.
Here are a few key chart patterns that traders use in technical analysis:
- Head and Shoulders: This pattern consists of three peaks, with the middle peak being the highest (the head) and the two outer peaks (the shoulders) being lower. A break below the neckline of this pattern is considered a bearish signal.
- Double Top/Double Bottom: The double top pattern occurs when price reaches a peak, retraces, and then returns to the same peak level. Conversely, the double bottom pattern occurs when price reaches a low, retraces, and then returns to the same low level. These patterns indicate a possible reversal in trend.
- Ascending/Descending Triangle: An ascending triangle is formed when price moves up with a horizontal resistance level, while a descending triangle is formed when price moves down with a horizontal support level. Traders look for breakouts from these patterns to determine the direction of the next move.
- Symmetrical Triangle: This pattern is formed when the price consolidates, creating a series of higher lows and lower highs, resulting in a converging triangle shape. Breakouts from this pattern can indicate future price movement.
- Flag and Pennant: Flag and pennant patterns are short-term continuation patterns that occur after a sharp price movement. A flag pattern looks like a rectangle, while a pennant pattern looks like a small symmetrical triangle. Traders watch for breakouts from these patterns to enter trades in the direction of the previous trend.
Chart patterns alone are not foolproof indicators, but when used in conjunction with other technical analysis tools and indicators, they can provide valuable insights into the market dynamics. Traders often look for confirmation signals, such as volume or momentum indicators, to validate the patterns they identify.
Chart patterns play an integral role in technical analysis. They can help traders identify potential trading opportunities, determine the direction of the next price movement, and make informed decisions. It is essential for forex traders to learn and understand different chart patterns and their implications to enhance their trading strategies.
How to Use Technical Analysis for Forex Trading
When it comes to forex trading, technical analysis plays a crucial role in helping me make informed decisions. By analyzing historical price data and market patterns, I can identify potential trends and trading opportunities. Here are a few steps I follow to effectively use technical analysis in my forex trading strategy:
- Identify the Timeframe: Before diving into technical analysis, I first decide on the timeframe I want to focus on. This could be a short-term timeframe like the 5-minute or 15-minute charts, or a longer-term timeframe like the daily or weekly charts. This decision depends on my trading style and the goals I have set.
- Use Multiple Indicators: To gain a comprehensive understanding of the market, I utilize multiple technical indicators. These indicators, such as moving averages, RSI, Bollinger Bands, Fibonacci retracement, MACD, and Ichimoku Cloud, provide valuable insights into market trends, support/resistance levels, and potential reversal points. By combining these indicators, I can get a more accurate analysis and increase my confidence in trade setups.
- Identify Chart Patterns: Chart patterns are visual representations of price movements that can be extremely useful for identifying potential trading opportunities. I keep an eye out for patterns such as the head and shoulders, double top/double bottom, ascending/descending triangle, symmetrical triangle, and flag and pennant patterns. These patterns can indicate potential reversals or breakouts, allowing me to enter or exit trades at strategic points.
- Confirm with Volume and Momentum Indicators: While chart patterns are powerful, I know it’s important to confirm them with other technical indicators. Volume and momentum indicators, such as volume bars, MACD histogram, and stochastic oscillators, provide additional evidence to support the validity of a pattern. If I notice a breakout accompanied by high volume or a divergence between price and momentum, it strengthens my confidence in the trade setup.
- Plan Entry and Exit Points: Once I have identified a potential trading opportunity, I establish clear entry and exit points to manage risk and maximize profits. I set stop-loss orders to limit potential losses and take-profit orders to secure profits. By setting these parameters in advance, I can stick to my trading plan and avoid making impulsive decisions based on emotions.
Common Mistakes to Avoid in Technical Analysis
As an experienced trader, I have learned that technical analysis can be a powerful tool in forex trading. However, it’s important to be aware of common mistakes that traders often make when using technical analysis. By avoiding these mistakes, you can enhance your trading strategy and improve your chances of success. Let’s take a look at some of the most common mistakes to avoid in technical analysis:
- Relying solely on one indicator: Many traders make the mistake of solely relying on one indicator, such as moving averages or RSI, to make trading decisions. It’s important to remember that no single indicator is foolproof. Instead, I recommend using multiple indicators that complement each other and provide a more holistic view of the market.
- Ignoring the bigger picture: Another mistake traders often make is focusing too much on short-term charts and ignoring the bigger picture. It’s crucial to analyze multiple timeframes to get a comprehensive understanding of market trends. This will help you make more informed trading decisions and avoid getting caught up in short-term fluctuations.
- Ignoring risk management: Technical analysis can provide valuable insights into potential trading opportunities, but it’s equally important to manage risk effectively. Many traders make the mistake of placing too much emphasis on potential profits and neglecting proper risk management techniques. Always set stop-loss orders and calculate risk-to-reward ratios to protect your capital.
- Not considering fundamental analysis: While technical analysis is a valuable tool, it’s essential to also consider fundamental analysis when making trading decisions. Market events and news can have a significant impact on price movements, so it’s important to stay informed about economic indicators, geopolitical events, and central bank decisions.
- Overcomplicating the analysis: Sometimes, traders fall into the trap of overcomplicating their technical analysis. While it’s important to use a variety of indicators and tools, too much complexity can lead to analysis paralysis. Keep your analysis simple and focus on the key indicators that have proven to be effective for you.
Remember, technical analysis is just one piece of the puzzle in forex trading. It’s important to combine it with other tools, such as fundamental analysis and risk management, to make well-informed trading decisions. By avoiding these common mistakes and refining your technical analysis skills, you can increase your chances of success in the forex market.
Advantages and Limitations of Technical Analysis
Technical analysis is a powerful tool in forex trading that can provide valuable insights into market trends and potential price movements. However, like any other method of analysis, it also has its own set of advantages and limitations. In this section, I will discuss both aspects to give you a comprehensive understanding.
Advantages
- Objective Approach: Technical analysis relies on historical price data and chart patterns, allowing traders to make objective decisions based on facts rather than emotions or speculation.
- Timing and Entry Points: By studying chart patterns and indicators, technical analysis helps identify optimal entry and exit points, enabling traders to capitalize on market trends and maximize profits.
- Visual Representation: Charts and graphs used in technical analysis provide a visual representation of price movements, which helps traders quickly identify trends, patterns, and support and resistance levels.
- Suitable for Short-Term Trading: Technical analysis is particularly useful for short-term trading strategies, such as day trading, as it focuses on short-term price movements and market trends.
- Widely Used and Accepted: Technical analysis is widely used and accepted by traders and investors around the world, making it easier to find and interpret information and indicators.
- Subjectivity: Although technical analysis relies on data and indicators, interpreting them is subjective. Different traders may interpret the same information differently, leading to varying trading decisions.
- Limited Predictive Power: Technical analysis is based on past price movements, which may not always accurately predict future price movements. Market conditions, news events, and other factors can override technical signals.
- False Signals and Whipsaws: Technical indicators can generate false signals and whipsaws in volatile or sideways markets, leading to losses or missed opportunities.
- Lack of Context: Technical analysis focuses solely on price and volume data, often ignoring the underlying fundamentals of an asset. Ignoring the bigger picture can lead to missed opportunities or erroneous trading decisions.
- Over-Reliance: Relying solely on technical analysis without considering other factors, such as fundamental analysis or risk management, can increase the risk of losses and hinder overall trading performance.
Integrating Technical Analysis into Your Trading Strategy
When it comes to forex trading, integrating technical analysis into your strategy is crucial for making well-informed trading decisions. Technical analysis involves studying price charts, patterns, and indicators to forecast future price movements. By incorporating this approach into your trading strategy, you can gain valuable insights and enhance your trading success.
Here are some key steps to effectively integrate technical analysis into your trading strategy:
- Identify Trends: One of the fundamental principles of technical analysis is identifying trends. By analyzing price movements, you can determine whether the market is in an uptrend, downtrend, or moving sideways. This information can help you decide on the most suitable trading approach.
- Use Indicators: Technical analysis utilises various indicators to provide additional insights into market trends and potential reversals. Popular indicators include moving averages, MACD (Moving Average Convergence Divergence), RSI (Relative Strength Index), and Bollinger Bands. These tools can assist in identifying entry and exit points, confirming trend strength, and spotting potential reversals.
- Apply Support and Resistance Levels: Support and resistance levels play a crucial role in technical analysis. These levels represent price areas where buying or selling pressure is significant, causing price reversals or consolidations. By identifying and incorporating these levels into your strategy, you can better understand market reactions and plan your trades accordingly.
- Consider Chart Patterns: Chart patterns, such as triangles, double tops, head and shoulders, and flags, can provide valuable insights into potential price movements. These patterns indicate market sentiment and can help identify opportunities for profitable trades. By familiarising yourself with different chart patterns, you can improve your ability to predict market behaviour.
- Combine Technical Analysis with Fundamental Analysis: While technical analysis focuses on price movements, fundamental analysis examines economic indicators, news events, and geopolitical factors that can impact currency values. By combining both approaches, you can gain a more comprehensive understanding of the market and make better-informed trading decisions.
- Implement Risk Management: Integrating risk management techniques into your trading strategy is essential for protecting your capital and minimizing losses. Set stop-loss orders, determine your risk tolerance, and avoid overexposing yourself to a single trade. By managing risk effectively, you can preserve your trading capital and trade with confidence.
Conclusion
In this article, I have explored the importance of technical analysis in forex trading and introduced various tools and indicators used in this analysis. I have also highlighted common mistakes to avoid and emphasized the need to combine technical analysis with other tools like fundamental analysis and risk management.
By integrating technical analysis into your trading strategy, you can effectively identify trends, use indicators, apply support and resistance levels, consider chart patterns, and make well-informed trading decisions. This approach allows you to objectively analyze price movements, identify optimal entry and exit points, and take advantage of short-term trading opportunities.
Technical analysis is widely accepted among traders for its ability to provide a visual representation of market trends and patterns. However, it is important to remember that technical analysis should not be used in isolation. By combining it with fundamental analysis and risk management techniques, you can enhance your trading strategy and increase your chances of success in the forex market.
So, whether you are a beginner or an experienced trader, incorporating technical analysis into your trading approach can help you navigate the complexities of the forex market and make informed decisions based on historical price data and market trends.